Why Most Business Metrics Fail—And How to Fix Them
Did you know that over 60% of organisations measure their success with metrics that don’t drive real results? If you’re tracking numbers that look good but don’t translate into meaningful outcomes, you’re not alone — but you could be wasting time and resources.
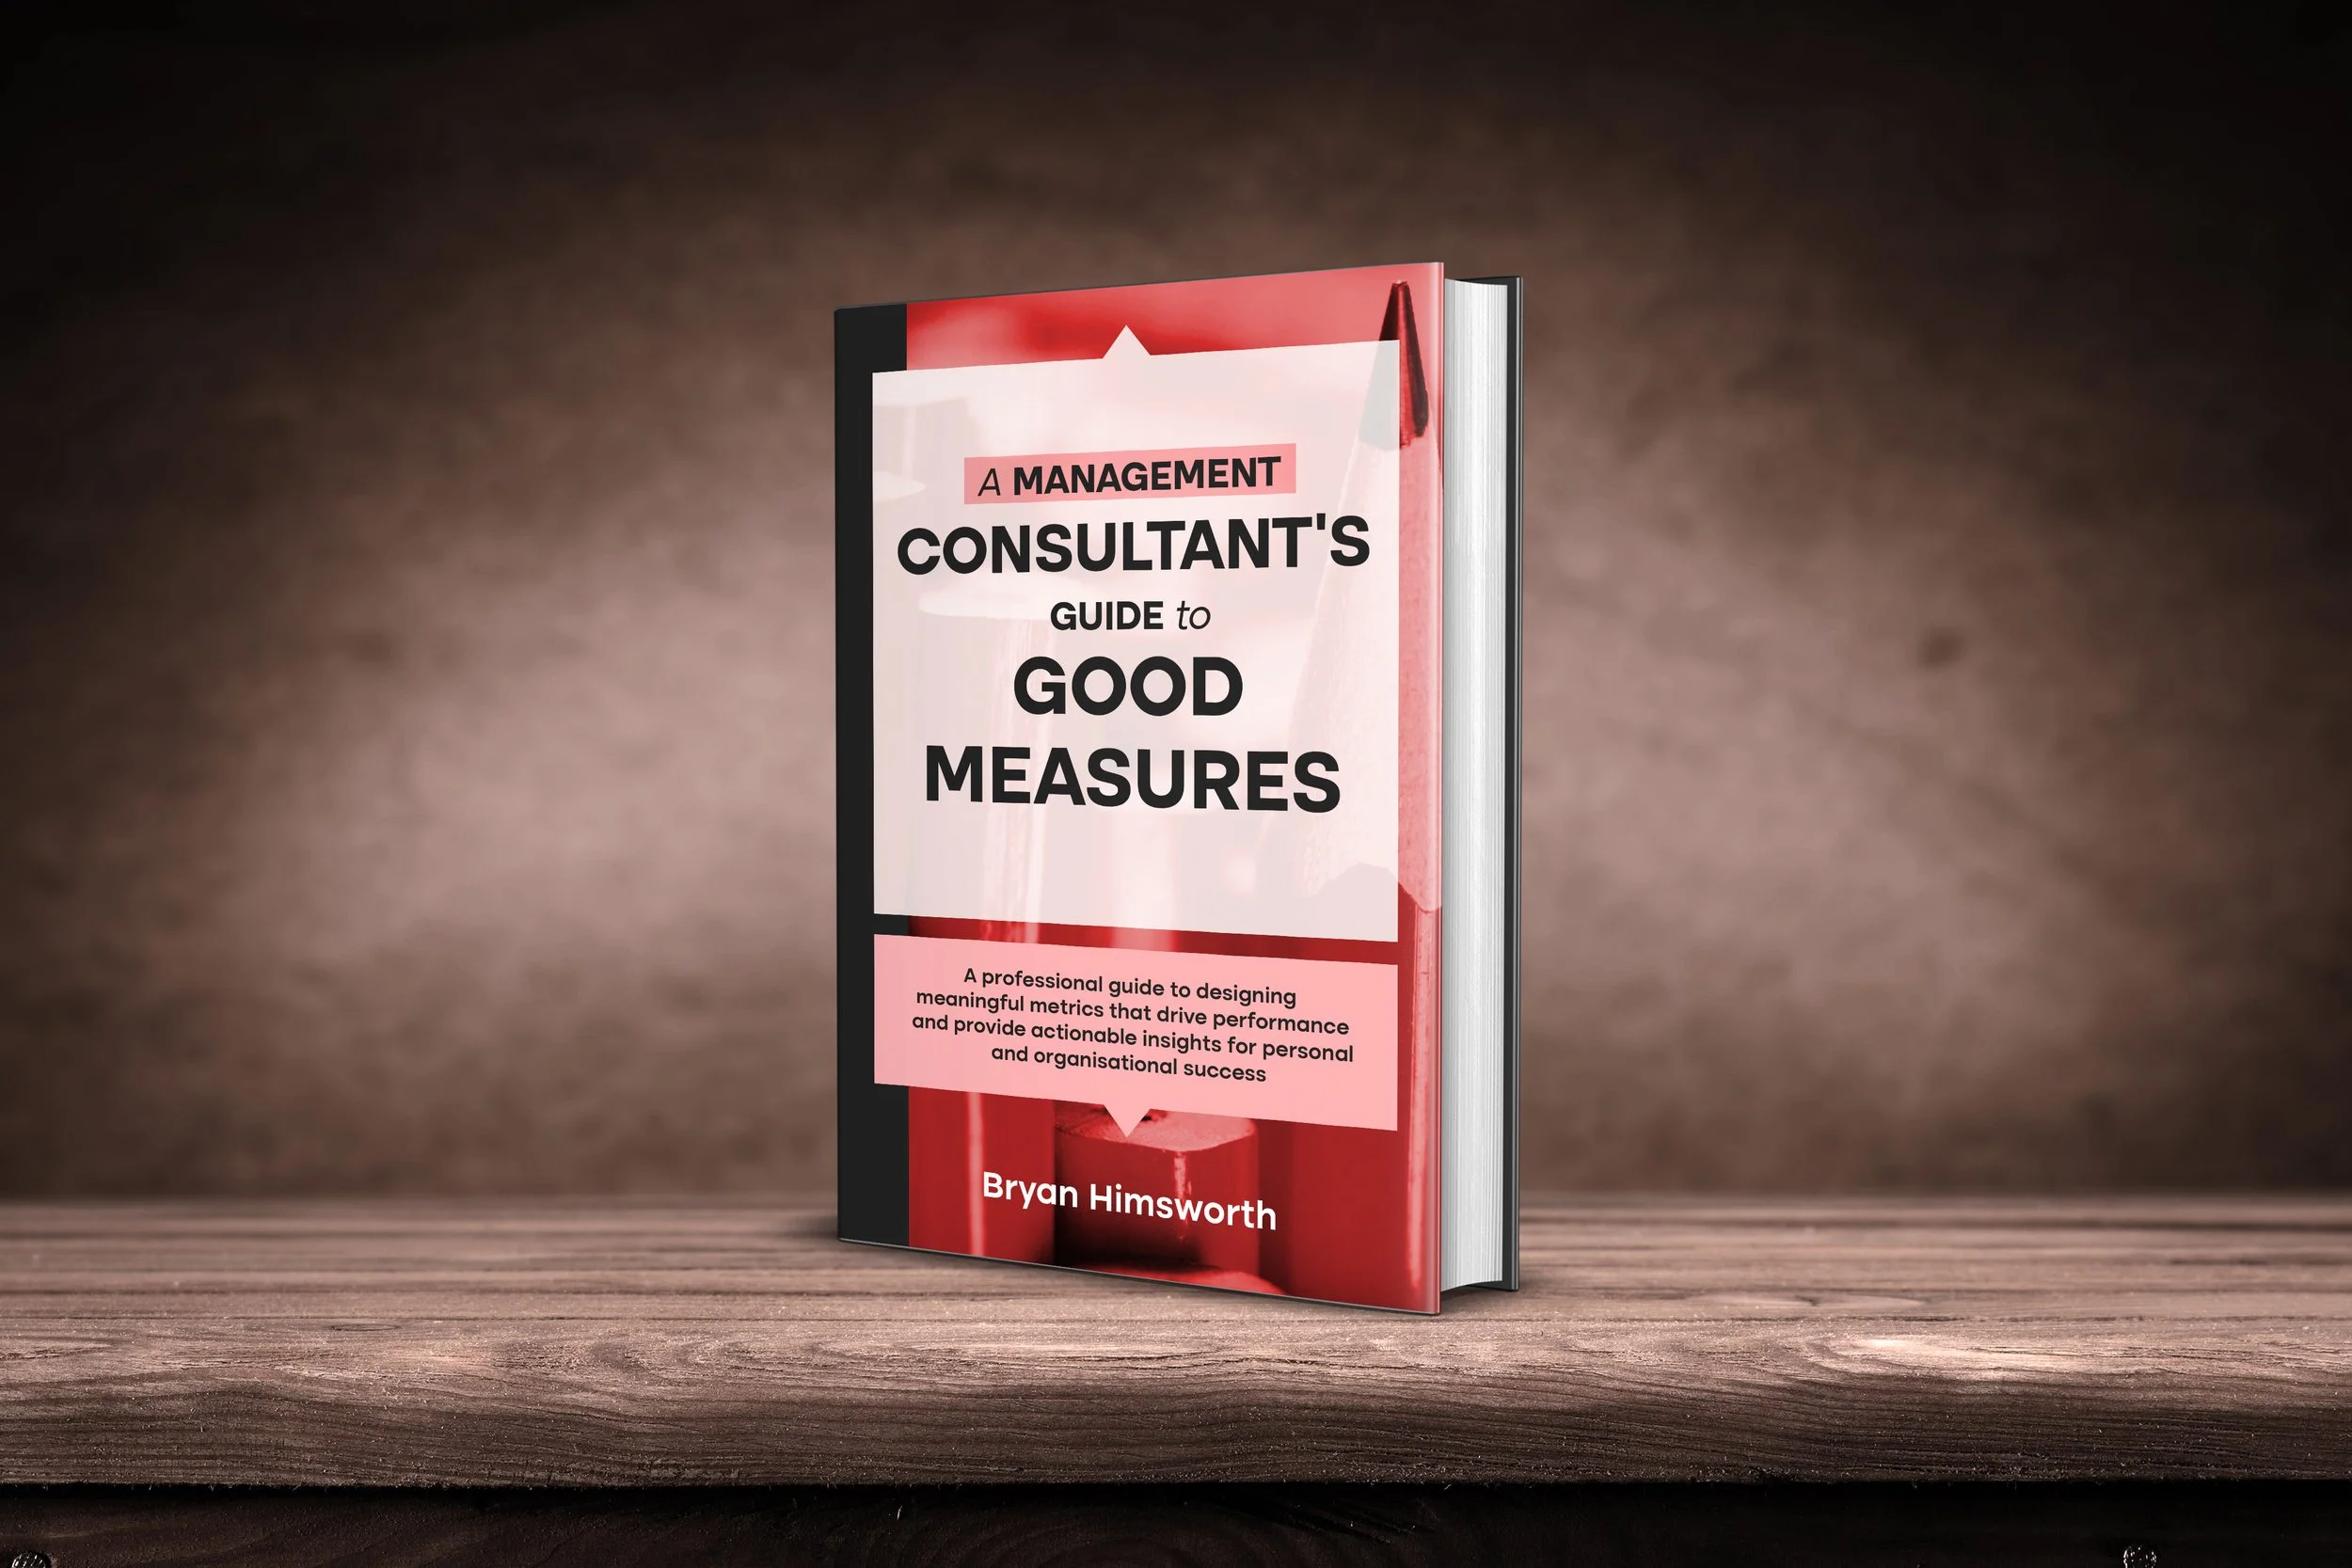
In this blog, I’ll reveal why most metrics fail, share a practical framework for measuring what truly matters, and introduce insights from my book, A Management Consultant’s Guide to Good Measures.
Where Organisations Go Wrong
Businesses rely on metrics to guide decision-making, but all too often, those metrics fall short. Here are the most common pitfalls I’ve observed:
1. Overemphasis on Lagging Indicators:
These metrics, such as revenue or profit, show what has already happened. While they’re useful for understanding results, they don’t help you predict or influence future outcomes.
2. Misaligned Metrics:
Many organisations focus on internal efficiency instead of what matters to their customers. For example, tracking how quickly customer service agents resolve calls may overlook whether the issue was resolved to the customer’s satisfaction.
3. Too Many Metrics:
Measuring everything often means measuring nothing well. When overwhelmed by data, leaders can lose sight of the most important insights.
4. The Productivity Trap:
Metrics that prioritise speed or volume, like “calls answered per hour,” can harm long-term success by sacrificing quality or customer experience.
Example:
Imagine a call centre that boasts record-high productivity because agents answer 50 calls per hour. But what if 30% of those calls are repeat issues caused by rushed conversations? The metric might look impressive, but the reality tells a different story.
The Three Pillars of Good Measures
To avoid these pitfalls, you need metrics that align with your goals and drive meaningful change. Here’s a simple framework to guide you:
1. Customer Alignment
Metrics should reflect what matters most to your customers. Ask yourself: What does success look like from their perspective? For example, in a retail business, this might mean tracking “on-time deliveries” rather than focusing solely on inventory turnover.
2. Leading Indicators
Unlike lagging indicators, which show past performance, leading indicators predict future results. They help you course-correct before problems arise. For instance, tracking “website traffic from new visitors” can signal future sales opportunities.
3. Visualisation and Trends
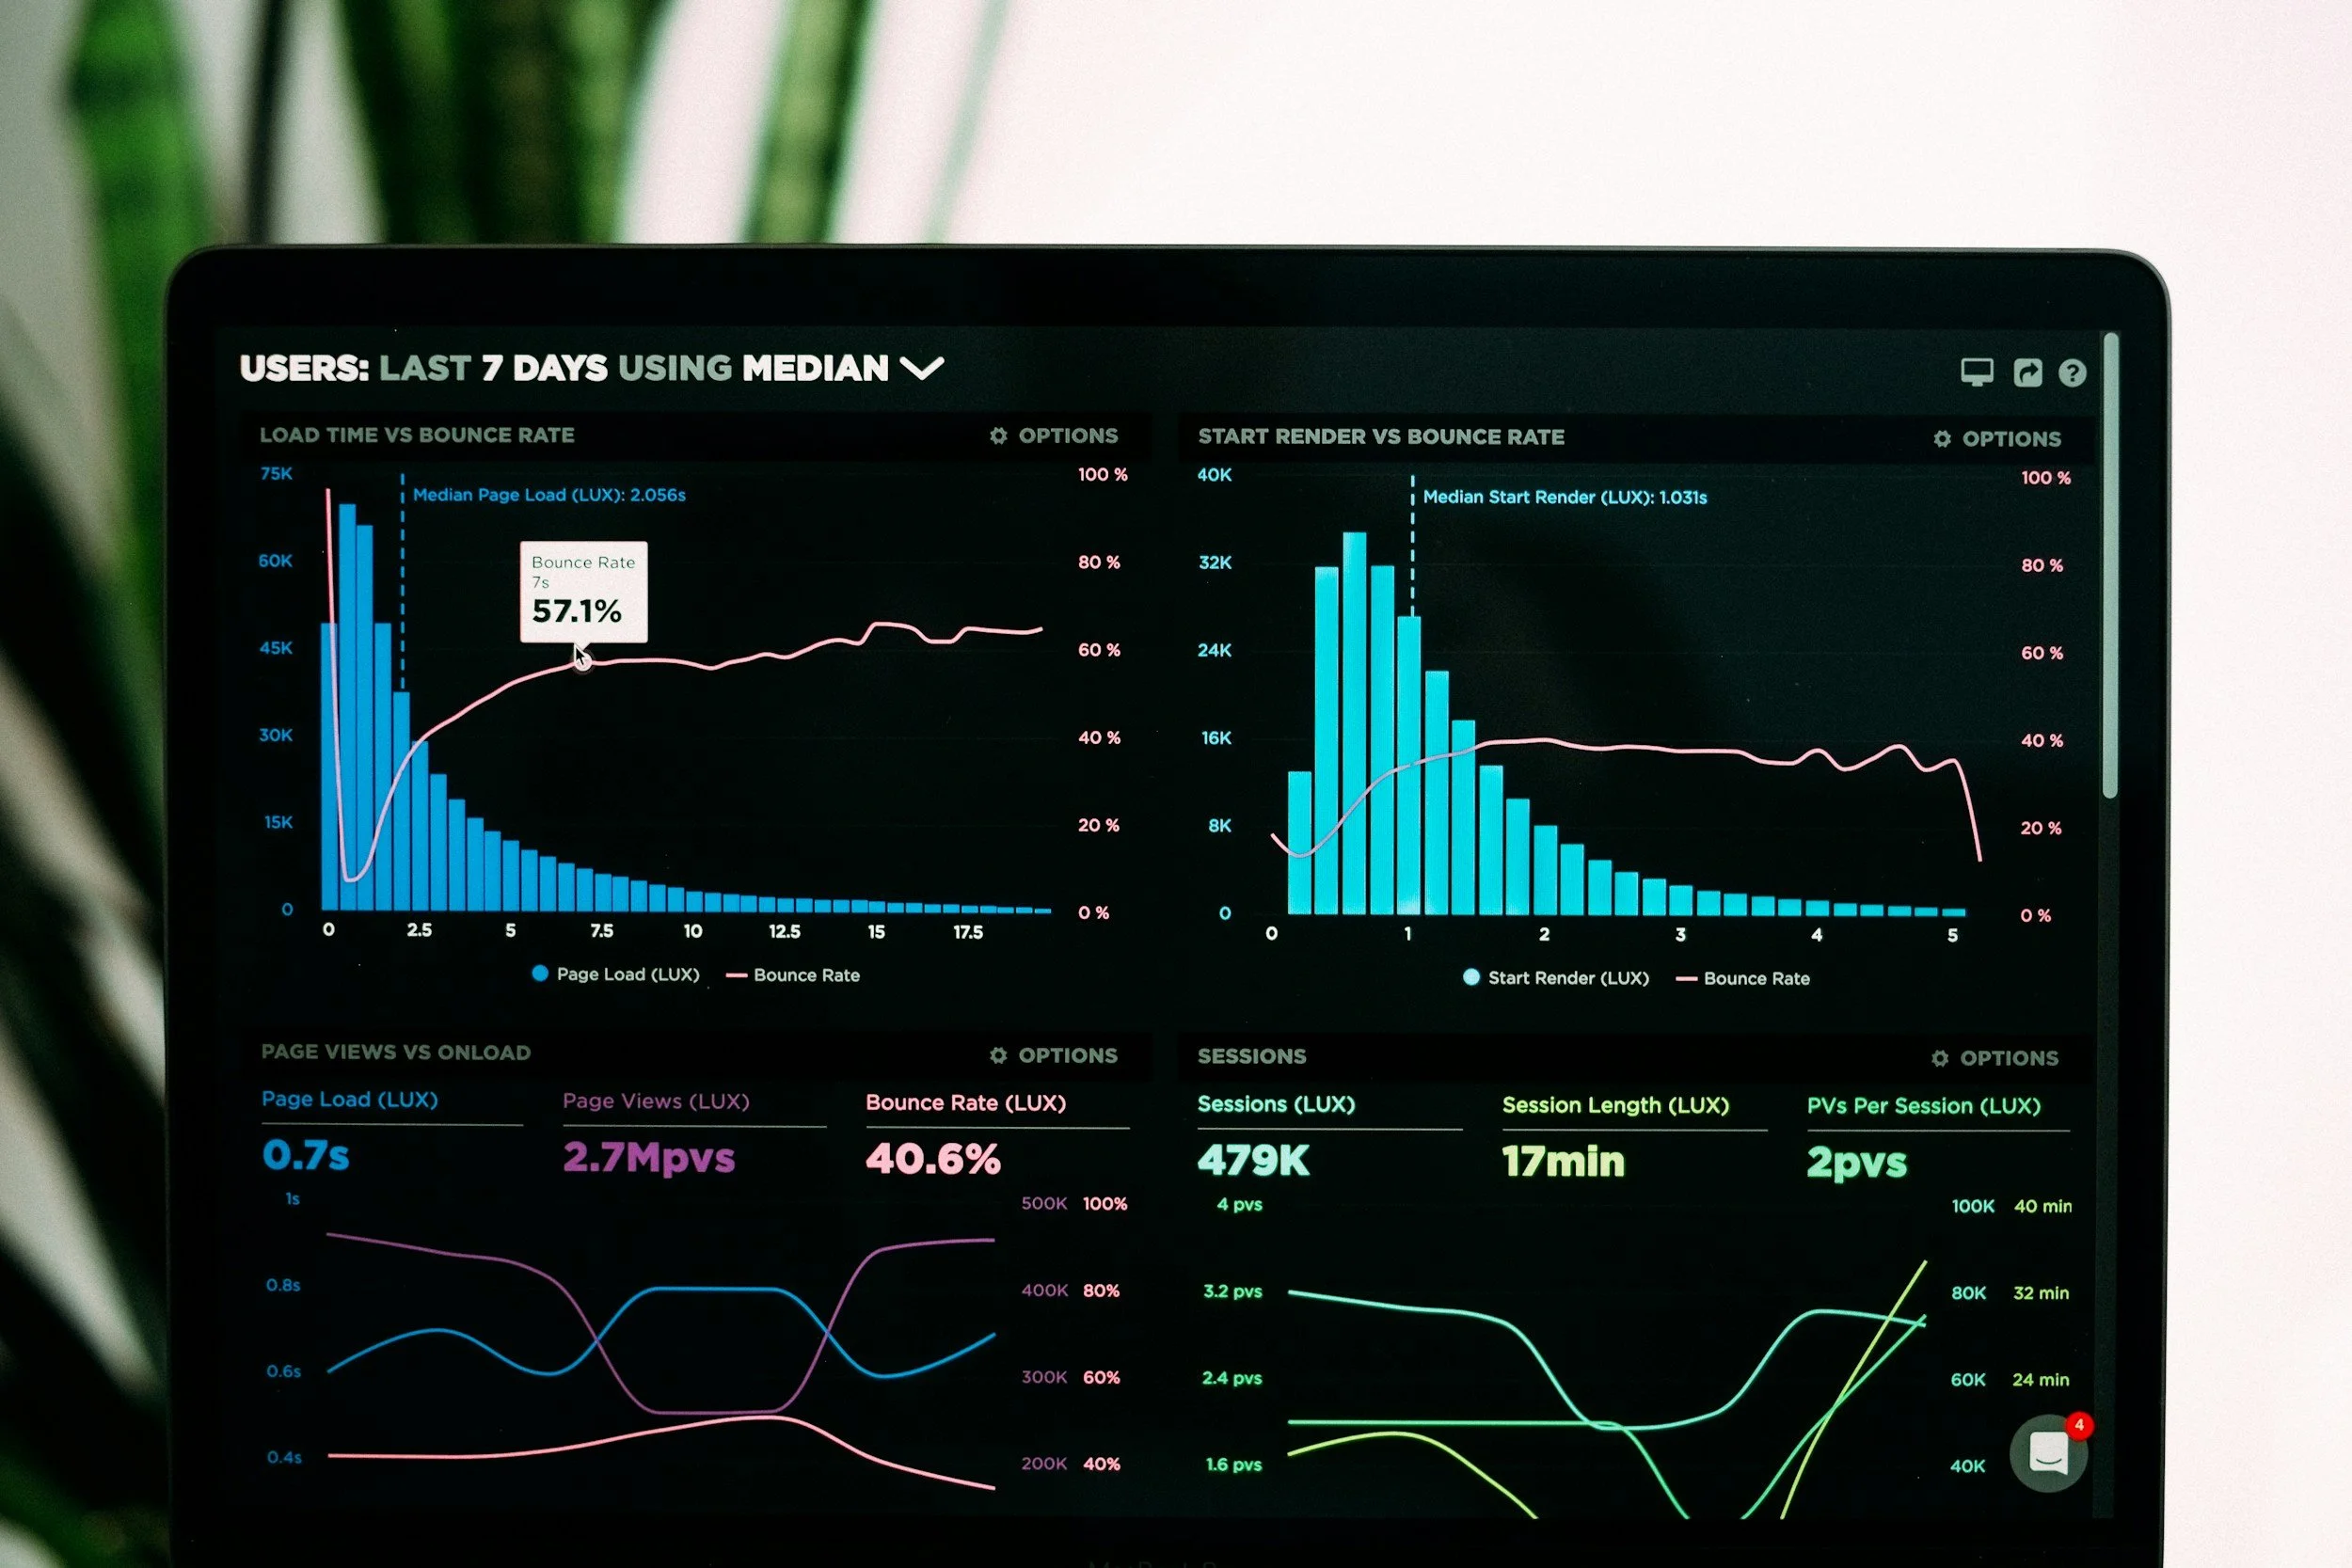
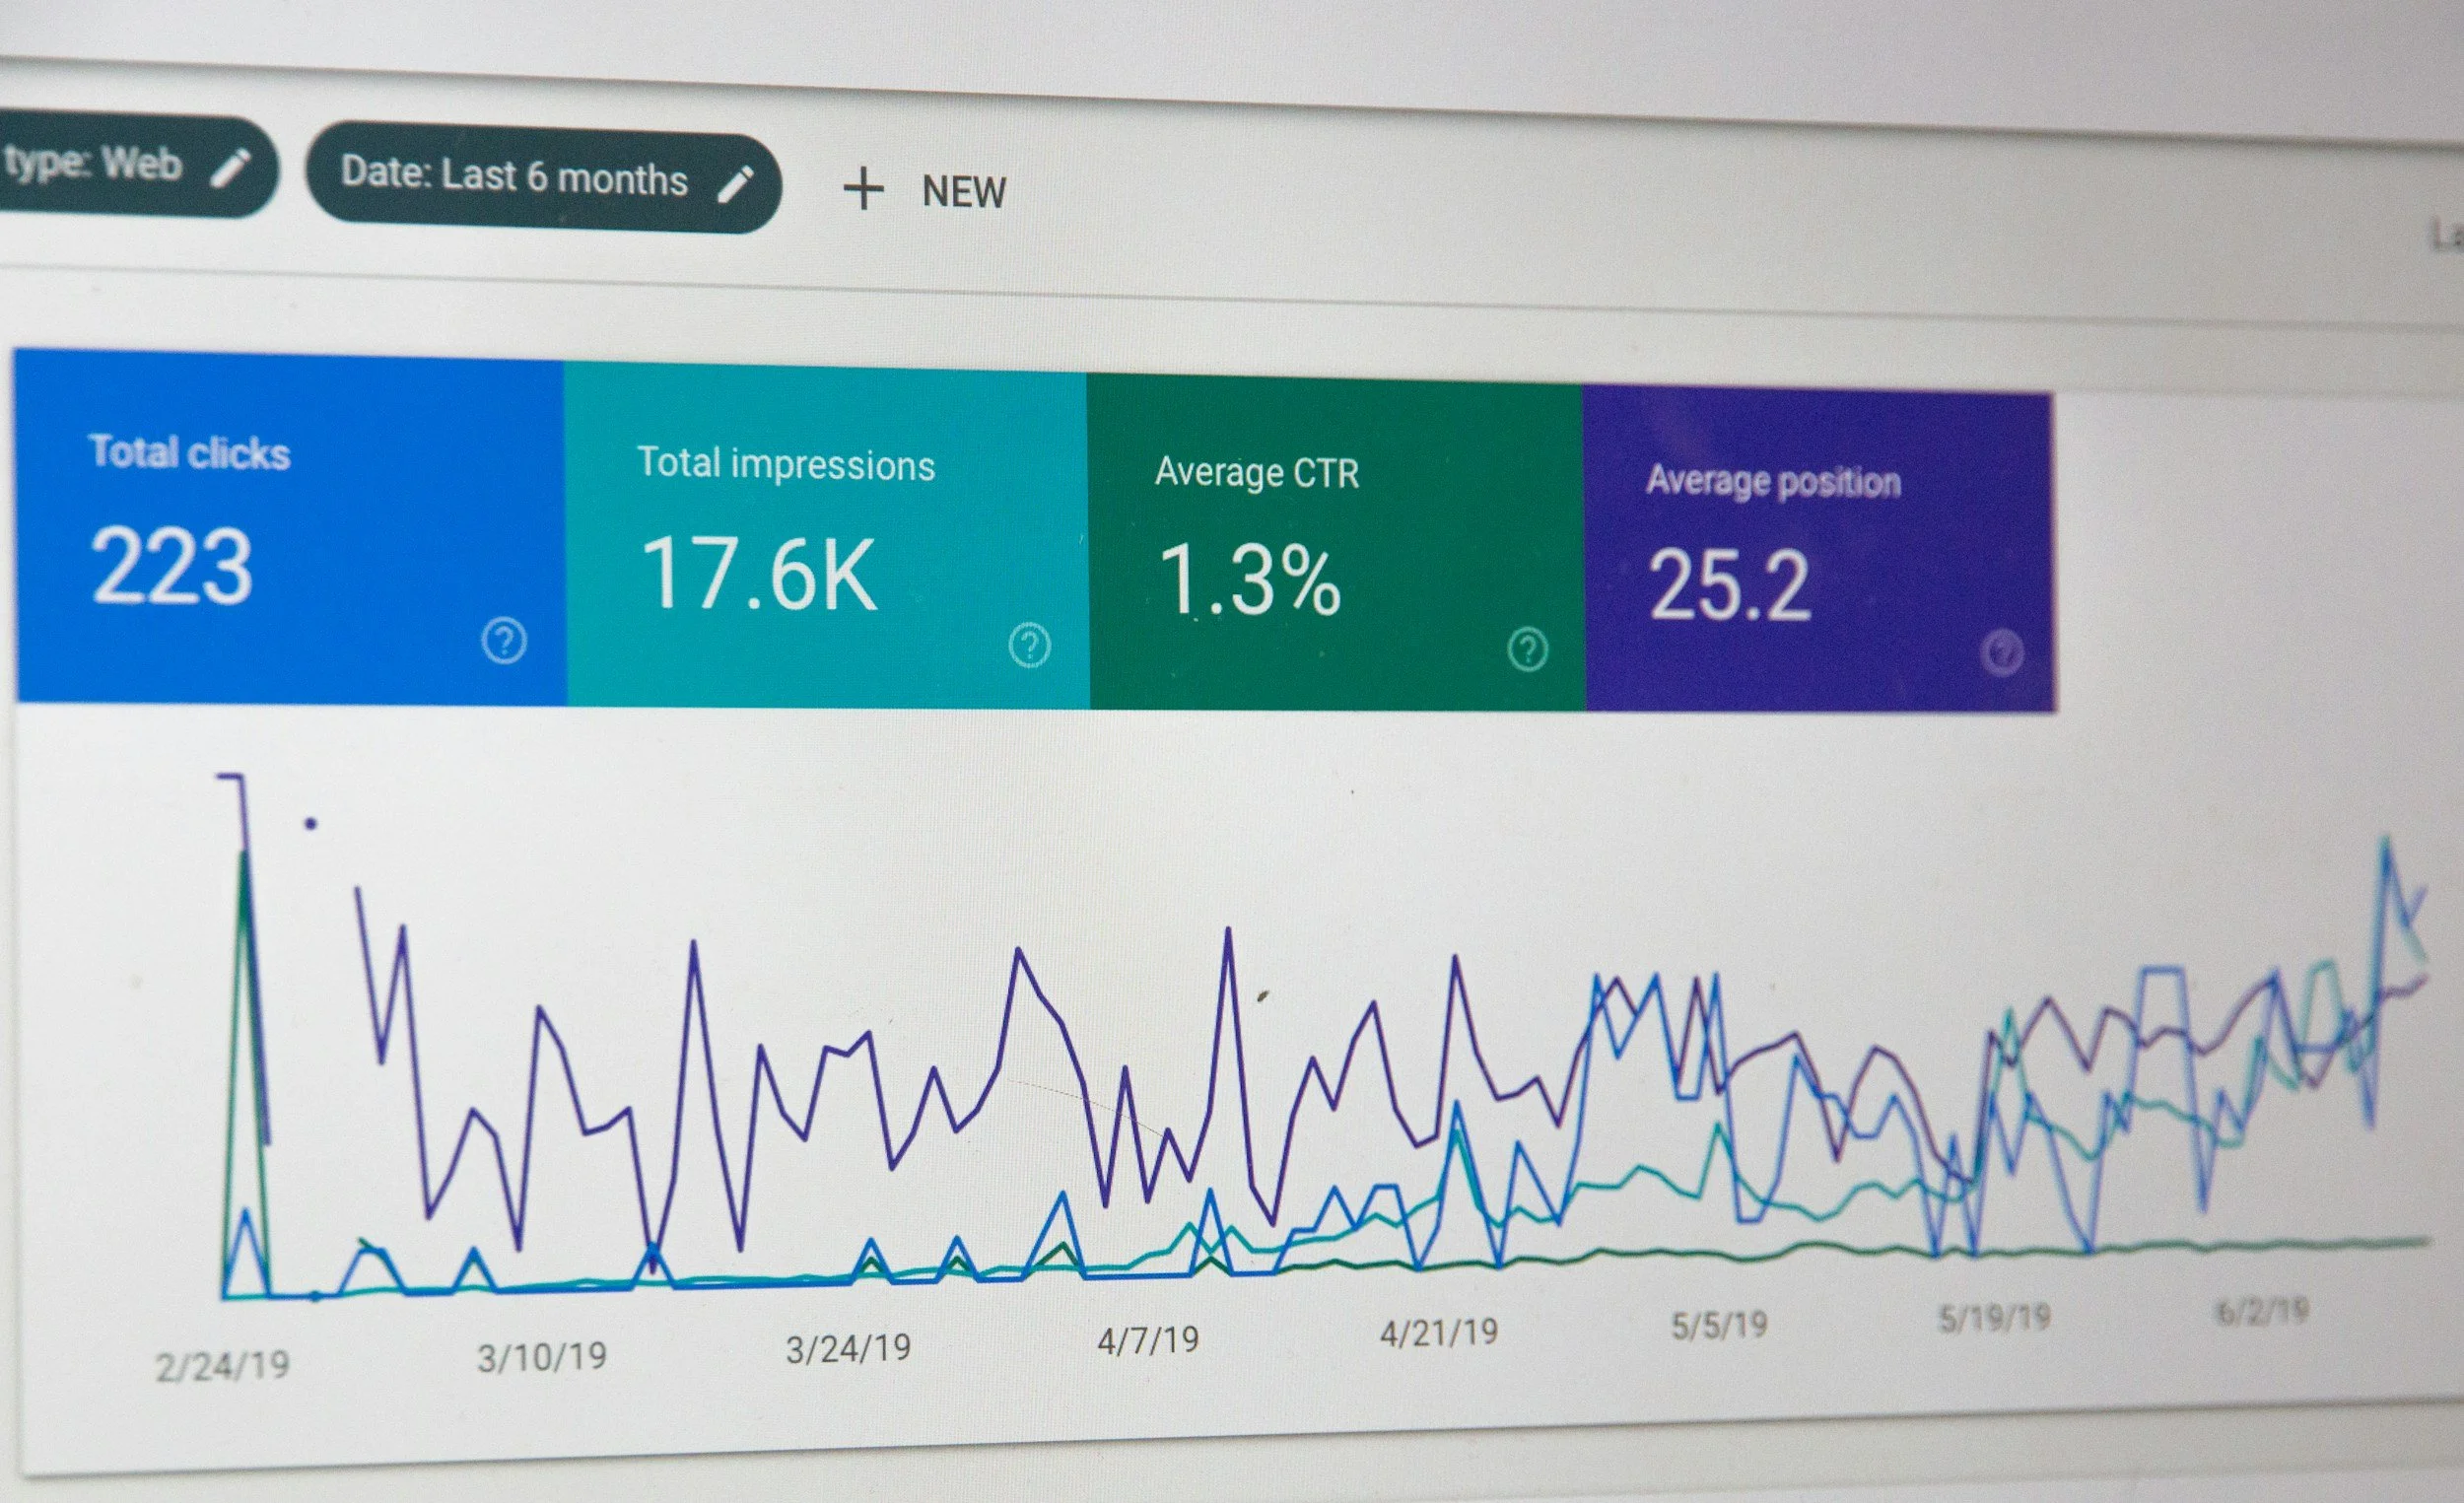
Metrics are most powerful when viewed over time. Trend graphs can reveal whether changes are part of a natural fluctuation or a real issue requiring action.
Example:
In my book, I explain how a retail chain shifted from tracking daily sales (lagging) to forecasting customer demand patterns (leading). This shift allowed them to prepare for peak periods and improve customer satisfaction.
Why One Data Point Isn’t Enough
Have you ever made a decision based on a single data point? It’s like looking at one frame of a film and thinking you know the whole story.
Understanding Variation:
Variation refers to the natural fluctuations in data over time. Without understanding it, you risk making knee-jerk decisions.
Example:
A hospital tracking patient wait times sees a sudden spike one day. Reacting without context — perhaps by reassigning staff — could create more problems than it solves. By analysing trends, they might discover that the spike was caused by a one-off event, like an IT outage, rather than a systemic issue.
Tracking variation helps you distinguish between natural patterns and real problems, allowing for more informed decisions.
Metrics in Action: A Success Story
While working with a construction company, I discovered that their accounts payable team was tracking efficiency by the number of invoices processed daily. This measure didn’t account for errors or delays caused by poor data.
We introduced a leading metric: “percentage of invoices processed without corrections.” By focusing on quality rather than quantity, the company saved millions each month and improved supplier relationships.
This is just one example of how good measures can transform business performance.
Take Your Measures to the Next Level
If you’ve found these insights helpful, you’ll love the actionable frameworks and case studies in my book, A Management Consultant’s Guide to Good Measures. It’s packed with tools to help you design, implement, and visualise measures that drive real results.
Ready to Transform Your Business?
Don’t settle for metrics that fail to deliver. Unlock the power of good measures today — grab your copy of A Management Consultant’s Guide to Good Measures and start transforming your business performance.
What’s the biggest challenge you face with your business metrics? Share your thoughts in the comments below!
Ready to Dive Deeper?
If you’d like to explore the principles of understanding and developing good measures, check out my book, A Management Consultant’s Guide to Good Measures, available on:
• Amazon
For more of my books or updates, visit my website: www.bryanhimsworthauthor.com. You can also follow me on:
• X


